Worum es geht
Optimierungsversuche des Praxismanagements sind für Haus- und Fachärzte aufgrund seiner komplexen Struktur und den vielfältigen Interaktionen der Aktionsbereiche oft sehr schwierig. Der Einsatz der Visualisierung-Technik löst dieses Problem.
Die Praxismanagement-Visualisierung als Lösung
Die Erfahrungen des Wirtschafts- und Privatlebens zeigen, dass mit der Komplexität von Zusammenhängen der Nutzen einer bildlichen Darstellung der Sachverhalte ansteigt. Deshalb bietet eine Praxismanagement-Visualisierung Ärzten für die Analyse und Entwicklung ihrer Arbeit den geeigneten Ansatz. Sie basiert auf der Generierung von Key Performance Indikatoren (KPIs), die
- das eingangs erwähnte Problem der Vielschichtigkeit der Praxisführung durch Ableitung von abbildbaren Orientierungsgrößen lösen,
- damit die Möglichkeit bieten, ohne großen Aufwand den Ist-Zustand des Praxismanagements anschaulich zu bestimmen und
- gleichzeitig Stärken, aber auch Defizite sowie ungenutzte Chancen und Risikofaktoren zu identifizieren.
Wie die Indikatoren entstehen
KPIs sind Kenngrößen, die durch den Vergleich der Praxismanagement-Daten einer Arztpraxis mit objektiven und repräsentativen Messgrößen entstehen. Hierfür wird mithilfe strukturierter Analysebögen (Arzt / Ärztin, MFA, Patienten(innen), ggf. Zuweiser(innen)) zunächst die Gestaltung der gesamten Praxisführung in einer 360-Grad-Sicht beschrieben und über eine dabei verwendete Skalierung in der späteren Auswertung quantifizierbar gemacht. So gelingt es nicht nur, Art und Intensität der eingesetzten Regelungen zur Praxisführung zu erfassen, sondern auch ihre Wirkungen.
Insights per Benchmarking
Diese Angaben werden dann einem Best Practice- und einem Fachgruppen-Benchmarking unterzogen:
- der Best Practice-Vergleich zeigt, ob alle Regelungen, Instrumente und Verhaltensweisen, die einen reibungslosen Praxisbetrieb gewährleisten, auch tatsächlich umgesetzt sind,
- die Fachgruppen-Relation gibt ergänzenden Aufschluss darüber, inwieweit die untersuchte Praxisführung dem Markt-Mindeststandard entspricht.
Aus den ermittelten KPIs ergibt sich eine detaillierte Statusübersicht der Stärken, Schwächen, Bedrohungen und Chancen der untersuchten Praxis mit einem detaillierten Aktionsplan für Verbesserungen, Veränderungen und Entwicklungen. Zudem können auf Basis der Praxis-Strategie individuelle Praxismanagement-Entwicklungsziele gebildet und im Hinblick auf den Fortschritt bei der Umsetzung kontrolliert werden.
Zur visuellen Umsetzung stehen hierbei verschiedene Formen zu Verfügung, beispielsweise:
Abweichungs-Diagramme

Kategorien-Raster
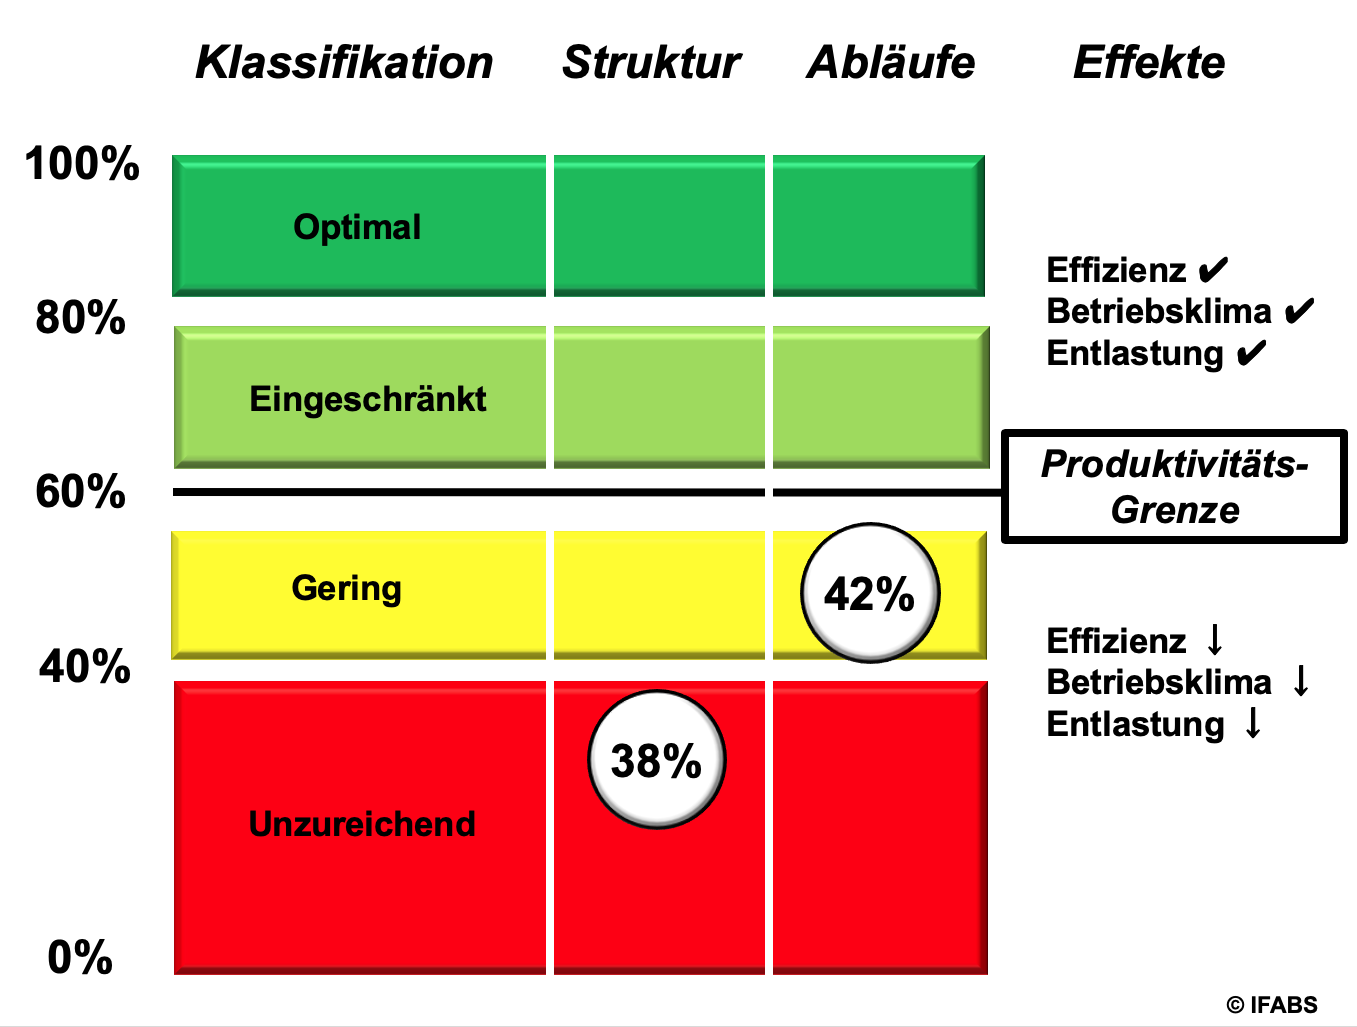
Portfolios

Cockpit- und Dashboard-Darstellungen
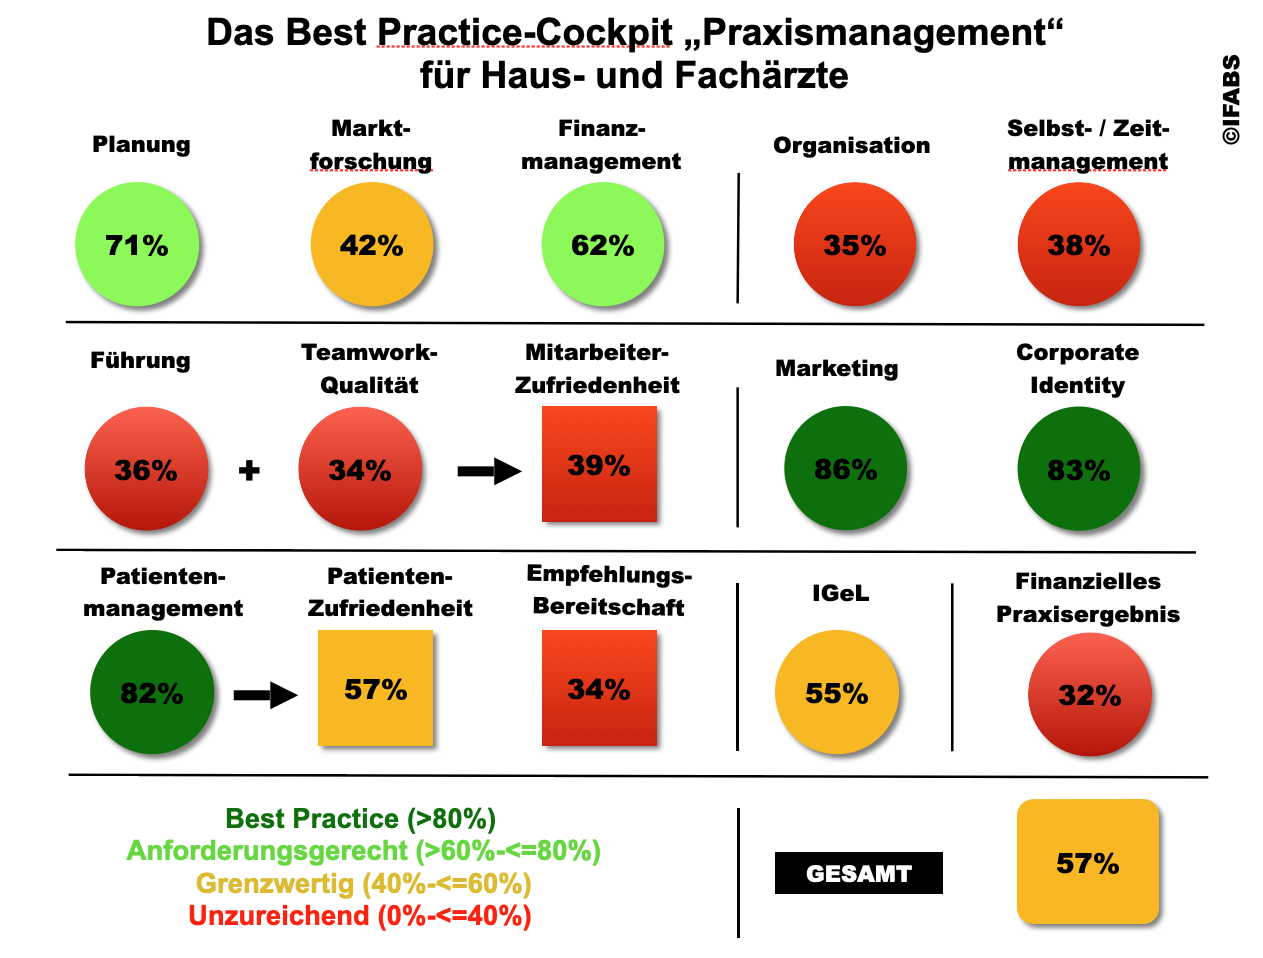
Unter Anwendung dieser Visualisierungs-Formen entspricht ein KPI-Statusbericht einer Art MRT-Abbild der Praxisarbeit und ihrer Resultate.
Easy-to-use“ und „Ready-to-go“
Das Besondere des Konzeptes der KPI ist, dass die Erhebung der notwendigen Angaben allein unter Verwendung speziell entwickelter, praxisbewährten Fragebögen und ganz ohne die Notwendigkeit eines Vor-Ort-Beraters erfolgen kann:
- die Bearbeitung des Arzt- / Ärztinnenbogens nimmt ungefähr 30 Minuten in Anspruch,
- die MFA-Unterlage ist in ca. 20 Minuten ausgefüllt,
- ergänzend erfolgt eine Patienten(innen)befragung, bei der bis zu 100 Praxisbesucher(innen) befragt werden können.
Für die Bearbeitung der Unterlagen werden keinerlei Fachwissen oder ergänzende Materialien benötigt.
Hohe Analyse-Qualität
Der Visualisierungs-Ansatz identifiziert aufgrund seiner umfassenden Betrachtungsbreite und Analyse-Tiefe in kürzester Zeit deutlich mehr ungenutzte Optimierung-Möglichkeiten der Praxisarbeit als eine Vor-Ort-Beratung, im Mittel knapp 40. Er ist jederzeit ohne Terminvereinbarung durchführbar und natürlich – durch Einsparung der Vor-Ort-Präsenz – deutlich kostengünstiger.
Hinzu kommt, dass Störungen des Praxisalltags entfallen und objektive Maßstäbe statt subjektiver Berater(innen)-Kriterien Verwendung finden. Das Instrument zur Umsetzung ist ein Praxismanagement-Betriebsvergleich.
Improving and developing practice management: Easy with the visualisation technique
What it’s all about
Attempts to optimise practice management are often very difficult for general practitioners and specialists due to its complex structure and the multiple interactions of the action areas. The use of visualisation technology solves this problem.
The practice management visualisation as a solution
The experiences of business and private life show that with the complexity of interrelationships, the usefulness of a visual representation of the facts increases. Therefore, a practice management visualisation offers doctors a suitable approach for the analysis and development of their work. It is based on the generation of key performance indicators (KPIs), which
- solve the problem of the complexity of practice management mentioned at the beginning of this article by deriving mappable orientation variables,
- thus offer the possibility of clearly determining the actual state of practice management without great effort and
- at the same time identify strengths, but also deficits as well as unused opportunities and risk factors.
How the indicators are created
KPIs are key performance indicators that are created by comparing the practice management data of a medical practice with objective and representative measured variables. For this purpose, the organisation of the entire practice management is first described in a 360-degree view with the help of structured analysis forms (doctor, MFA, patients, referring physicians, if applicable) and made quantifiable in the later evaluation by means of a scaling used in the process. In this way, it is not only possible to record the type and intensity of the regulations used for practice management, but also their effects.
Insights by benchmarking
These data are then subjected to a best practice and a specialist group benchmarking:
- the best practice comparison shows whether all regulations, instruments and behavioural patterns that ensure smooth practice operation are actually implemented,
- the specialist group ratio provides additional information on the extent to which the practice management examined corresponds to the minimum market standard.
The KPIs identified result in a detailed status overview of the strengths, weaknesses, threats and opportunities of the practice under review, with a detailed action plan for improvements, changes and developments. In addition, individual practice management development goals can be formed on the basis of the practice strategy and monitored with regard to progress in implementation.
Various forms are available for visual implementation, for example:
Deviation diagrams
Category grids
portfolios
Cockpit and dashboard displays
Using these forms of visualisation, a KPI status report corresponds to a kind of MRI image of the practice work and its results.
Easy-to-use” and “Ready-to-go”
The special feature of the KPI concept is that the collection of the necessary information can be done solely by using specially developed, practice-proven questionnaires and completely without the need for an on-site consultant:
- the doctor’s questionnaire takes about 30 minutes to complete,
- the MFA document is completed in about 20 minutes,
- In addition, a patient survey is conducted in which up to 100 practice visitors can be interviewed.
No specialist knowledge or supplementary materials are required to complete the documents.
High analysis quality
Due to its comprehensive scope of observation and depth of analysis, the visualisation approach identifies significantly more unused optimisation opportunities for practice work in a very short time than an on-site consultation, on average almost 40. It can be carried out at any time without an appointment and is of course – due to the saving of on-site presence – significantly more cost-effective.
In addition, there are no disruptions to the daily routine of the practice and objective criteria are used instead of subjective criteria of the consultant(s). The instrument for implementation is a practice management comparison.
